How to Use Order Flow in Forex Trading
Posted On - November 15, 2025 | By - FXProfitBuilder | Categories - Advanced Trading Concepts
Introduction

In the world of Forex, price movement is the visible result of something deeper order flow. Every candle, every spike, every breakout is driven by the imbalance between buying and selling orders.
Understanding order flow gives traders a behind-the-scenes look at what’s truly driving the market helping identify strong entries, early reversals, and liquidity traps before they happen.
Let’s break down how you can use order flow to sharpen your trading edge and align your strategy with institutional activity.
What Is Order Flow in Forex?
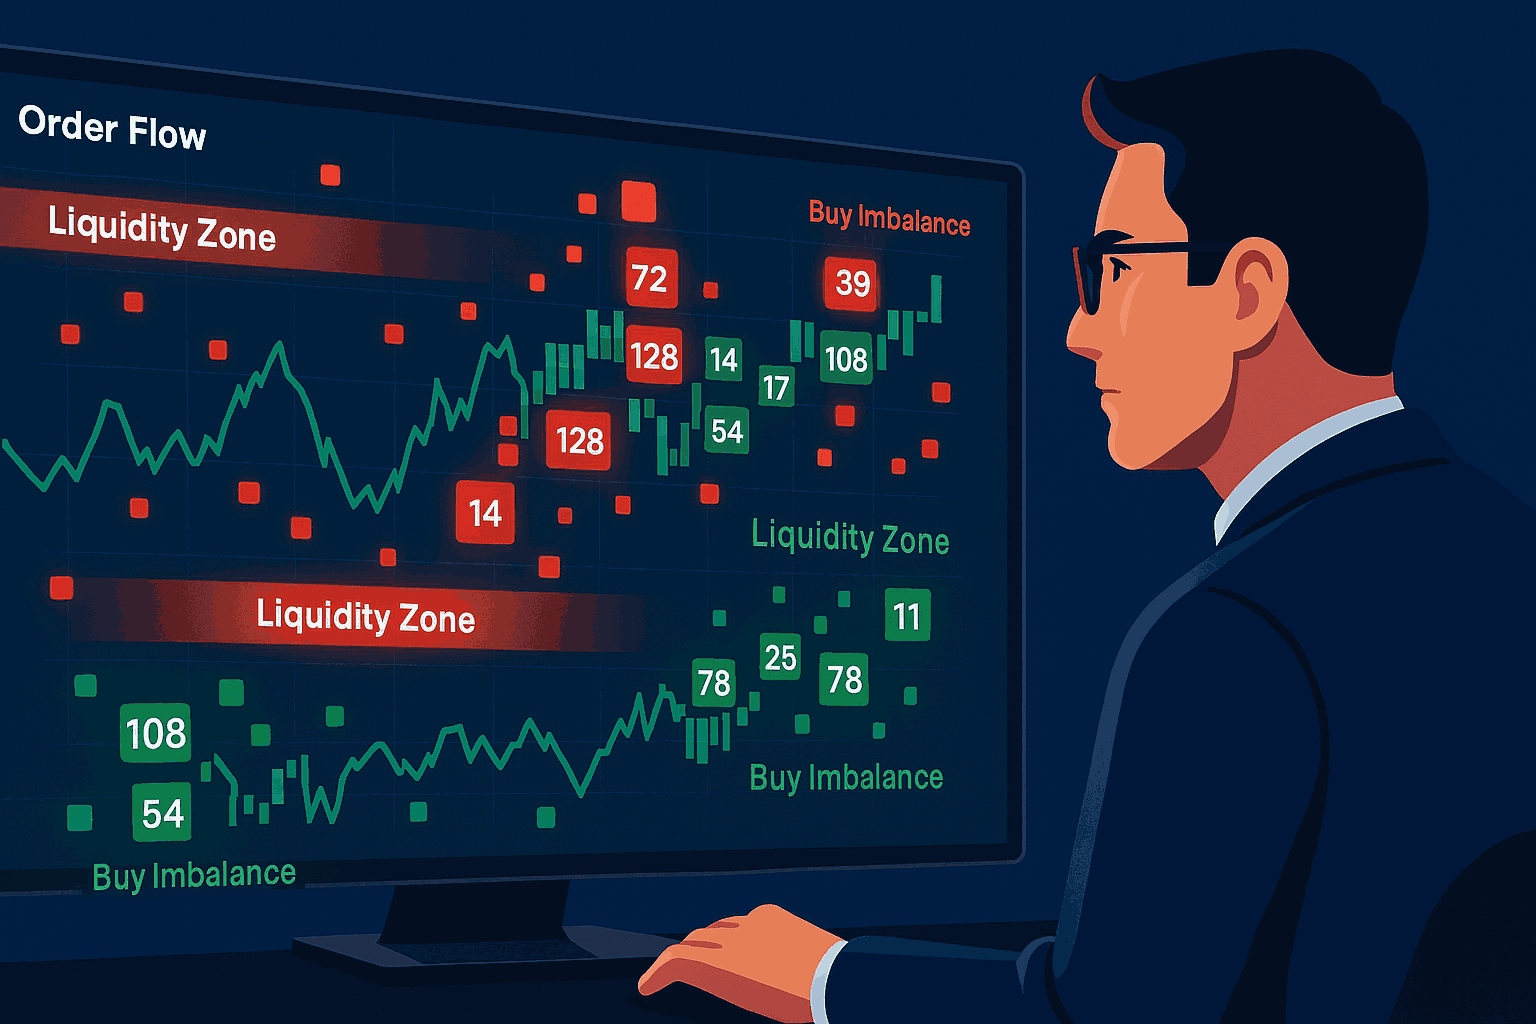
Order flow refers to the real-time record of buy and sell orders being executed in the market.
In other words, it’s the ongoing tug-of-war between buyers (demand) and sellers (supply).
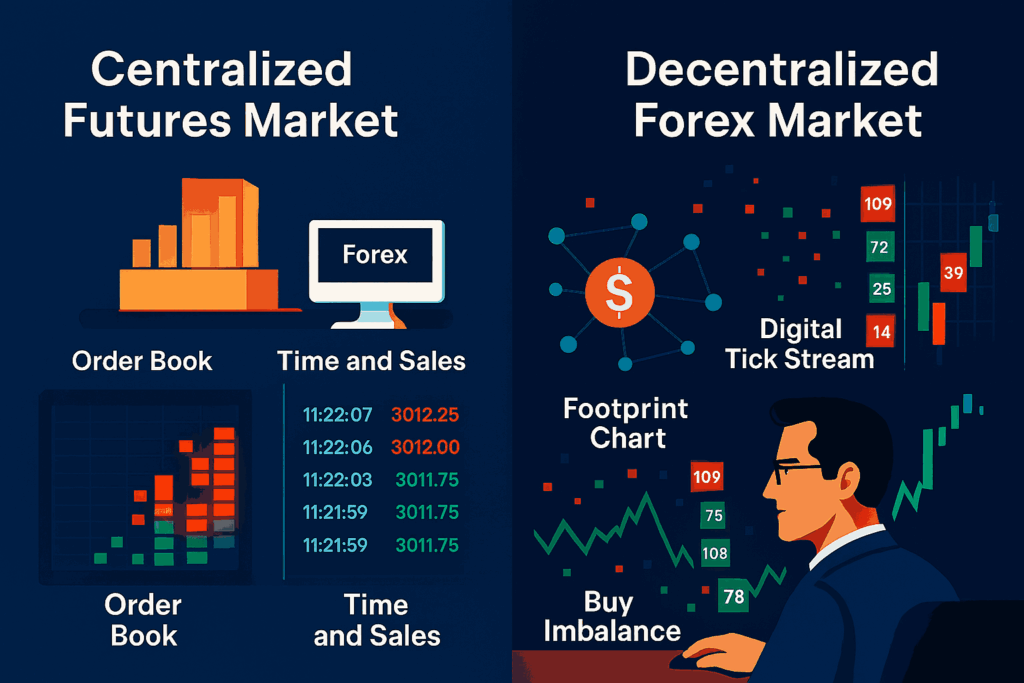
In centralized markets (like futures), traders can see actual volume and order flow through a “Time & Sales” window.
But since Forex is decentralized, traders use tick volume, footprint charts, or order flow indicators to approximate this data and understand market intent.
Why Order Flow Matters
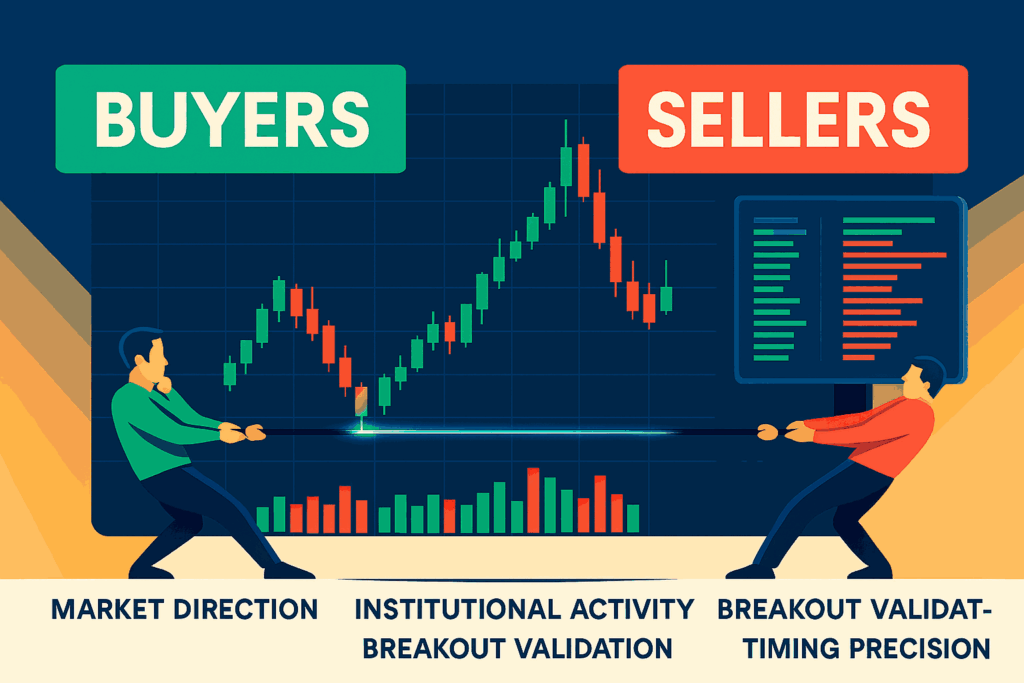
Order flow reveals who is in control of the market buyers or sellers and how strong their conviction is.
When used correctly, it helps traders:
- Confirm Market Direction – Identify if price moves are backed by real buying/selling strength.
- Detect Institutional Activity – Spot large orders that move price significantly.
- Avoid Fake Breakouts – Recognize when breakouts lack real order flow support.
- Time Entries and Exits Precisely – Get in and out based on real liquidity zones instead of random support/resistance lines.
Key Concepts in Order Flow Trading
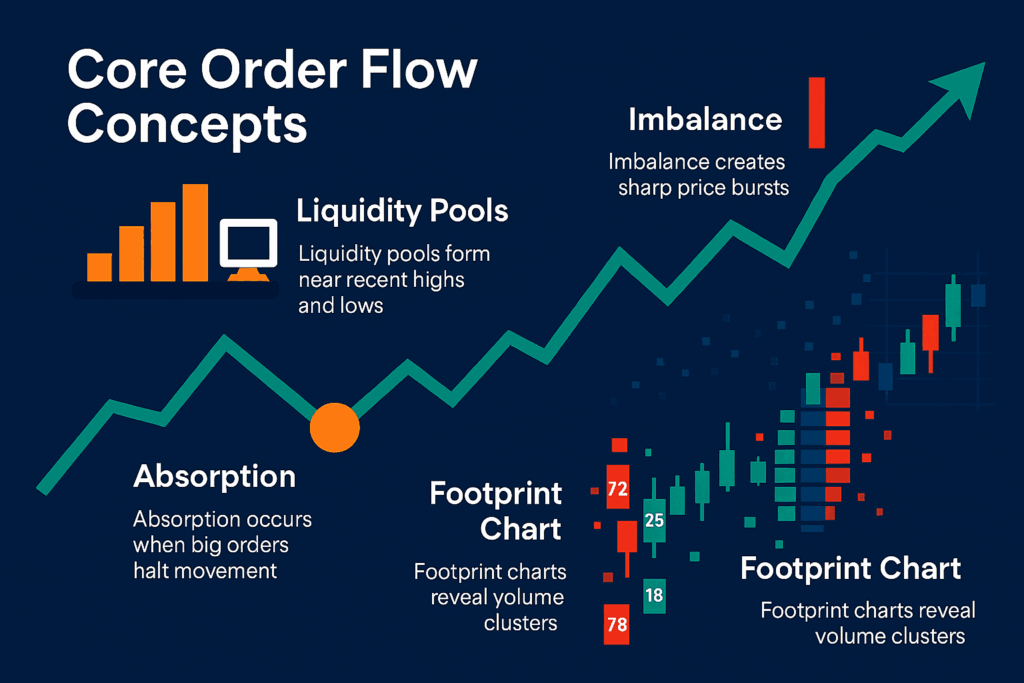
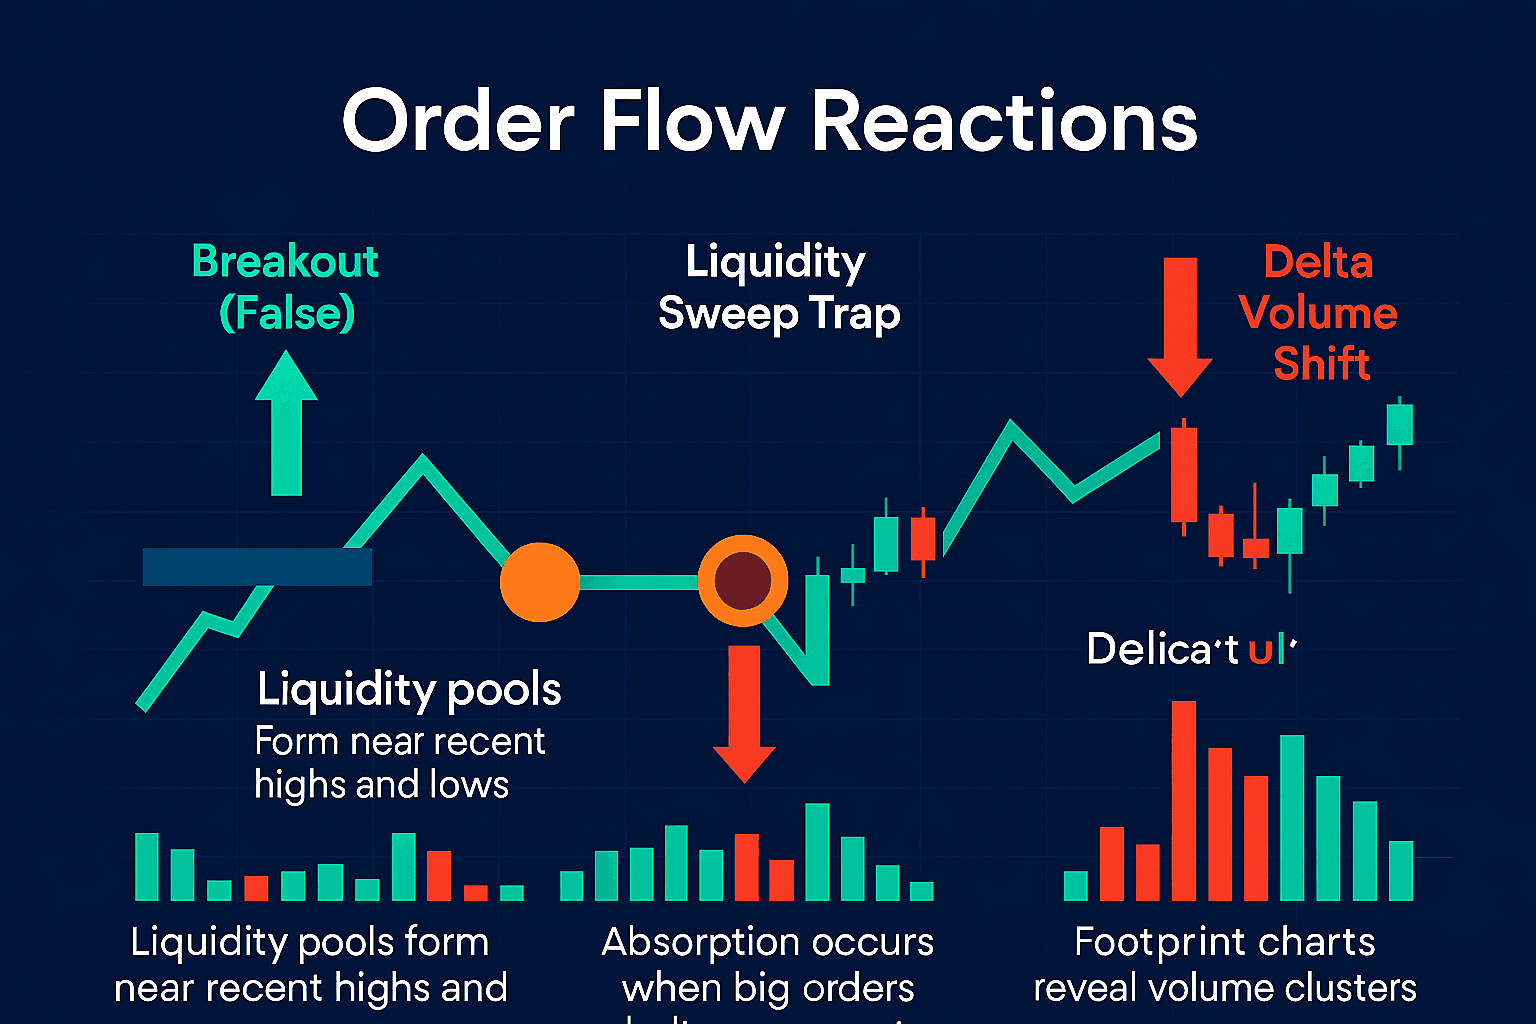
1. Liquidity Pools
These are areas where many stop-loss or pending orders accumulate often near obvious highs/lows. Smart money targets these zones before reversing price.
2. Imbalances
When there are more aggressive buyers than sellers (or vice versa), price moves quickly in one direction that’s an order flow imbalance.
3. Absorption
When a large order absorbs the opposite side (e.g., big sellers absorbing buy orders), it signals potential reversals.
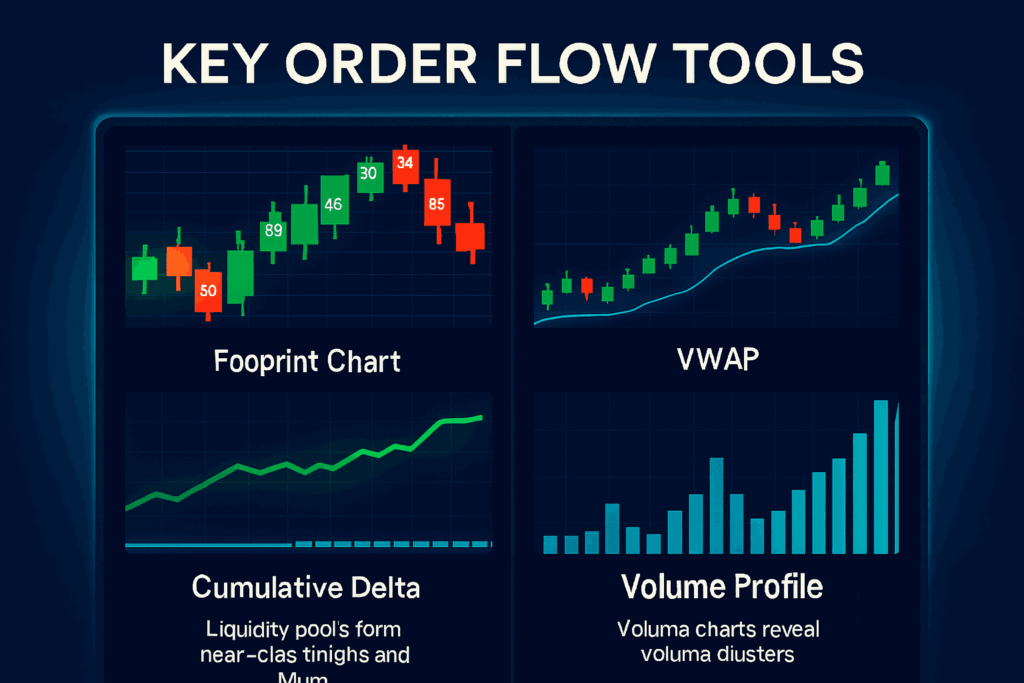
4. Footprint Charts
These display traded volume at each price level, helping identify where heavy buying or selling took place.
How to Read Order Flow Effectively
1. Combine with Price Action
Watch how volume and tick activity behave around key levels.
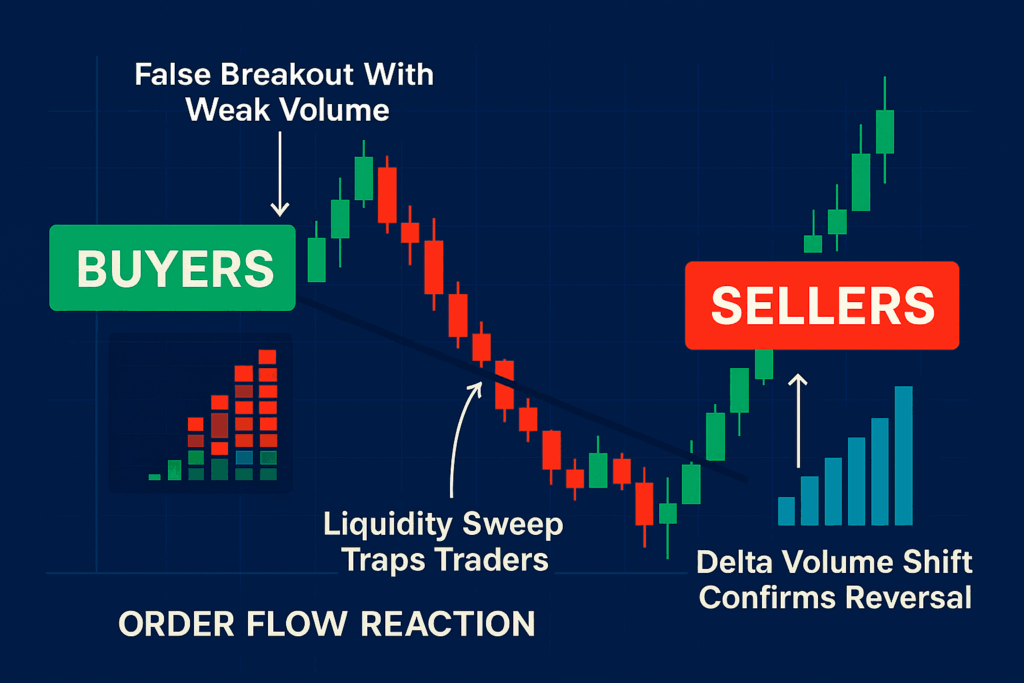
For example, if price breaks resistance but tick volume doesn’t increase, it’s likely a false breakout.
2. Identify Trapped Traders
When price quickly reverses after taking out a liquidity pool, it often traps traders providing a strong reversal setup.
3. Confirm Reversals
If price forms a new high but order flow shows weaker buying pressure, institutions may be distributing signaling a potential top.
4. Use Delta Volume
Delta volume measures the difference between market buys and market sells helping determine who’s dominating.
Order Flow Tools and Indicators
- Footprint Chart – Shows executed volume per price level.
- Cumulative Delta Indicator – Tracks buying vs. selling pressure.
- Volume Profile – Highlights where the most trading occurred.
- VWAP (Volume-Weighted Average Price) – A benchmark line showing institutional entry levels.
Advantages of Order Flow Analysis
✅ Provides transparency on market behavior
✅ Helps filter false signals
✅ Improves entry precision
✅ Reveals institutional intent
✅ Strengthens trade confirmation when used with other methods (e.g., price action + volume)
Common Mistakes to Avoid
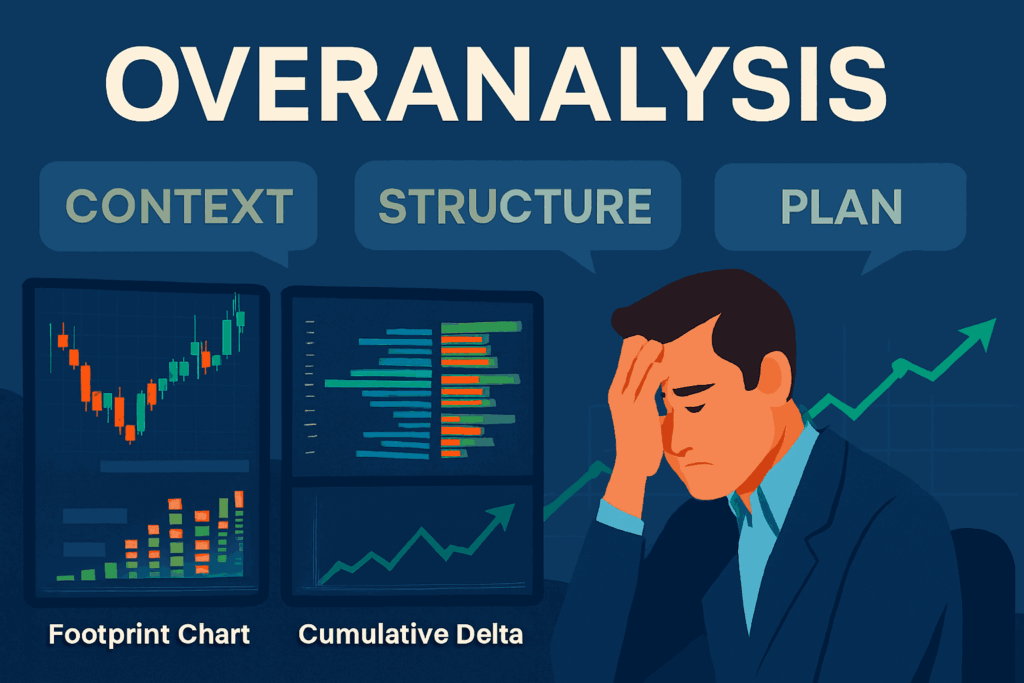
❌ Overanalyzing every tick focus on zones of interest
❌ Ignoring context order flow should align with market structure
❌ Using it in isolation combine it with your existing trading plan
Conclusion

Order flow analysis is like having X-ray vision into the market’s core mechanics. It shows what traditional indicators often hide the real battle between buyers and sellers.
By mastering order flow, you can align your trades with institutional liquidity, avoid traps, and trade with confidence backed by data, not guesswork.
At FXProfitBuilder, we integrate advanced order flow principles into our trading signals helping traders make data-driven decisions with unmatched accuracy.
FAQ Section

Q1. Can retail traders really access order flow data?
Yes. While Forex lacks centralized data, tick volume and footprint tools like Bookmap or Sierra Chart give traders valuable insights.
Q2. Is order flow suitable for beginners?
It’s advanced but worth learning gradually. Start by analyzing volume behavior around key price levels.
Q3. How does order flow differ from volume?
Volume shows the number of trades, while order flow shows who’s buying or selling and how aggressively.
Q4. Can order flow help in news trading?
Yes , it can reveal whether institutional traders are absorbing volatility or fueling a breakout post-news.
👉 Start your journey today—subscribe to our forex pip tips service and see the difference for yourself! Sign Up to get Exclusive Offers