How to Read Forex Charts Like a Pro
Posted On - January 20, 2025 | By - FXProfitBuilder | Categories - Forex Trading Strategies
Forex trading revolves around understanding and interpreting charts. For traders, these charts are more than just visual representations of price movements; they are tools for making informed decisions. If you want to elevate your trading game, mastering how to read forex charts is essential. In this article, we’ll guide you through the fundamentals of forex charts and offer tips to interpret them like a pro.
Understanding the Basics of Forex Charts
Forex charts represent the price movements of currency pairs over time. They provide a snapshot of market trends, helping traders analyse past performance and predict future movements. Here are the key components of forex charts:
- Currency Pair: Displayed as a pair (e.g., EUR/USD), indicating the base and quote currencies.
- Time Frame: Charts can be set to various time intervals, such as 1 minute, 1 hour, 1 day, or even longer.
- Price Axis: The vertical axis shows the price levels.
- Time Axis: The horizontal axis represents the timeline of the chart.
Types of Forex Charts
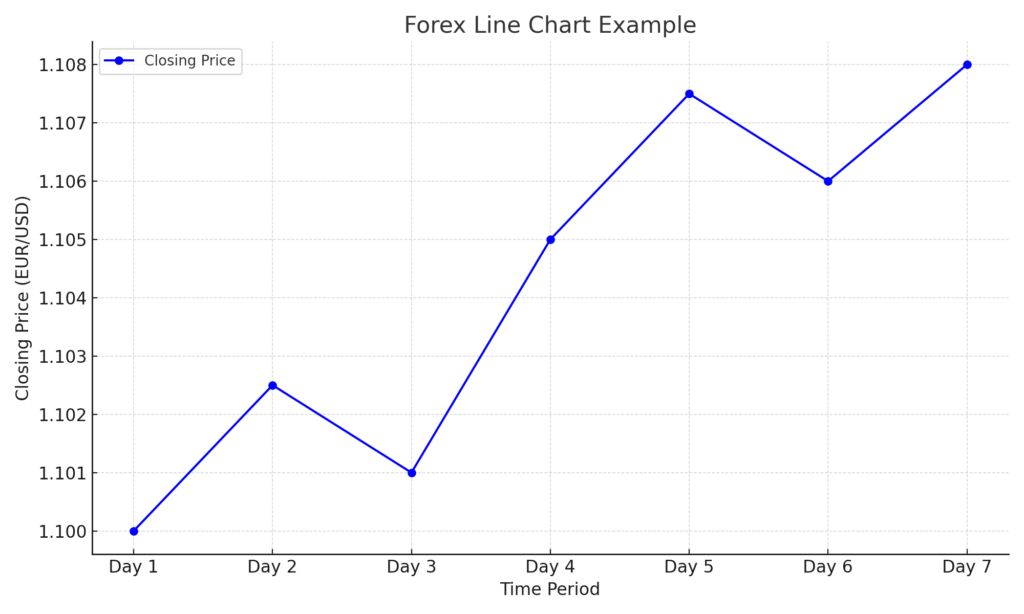
1. Line Chart:
- Simplest chart type, connecting closing prices with a single line.
- Best for identifying overall trends.
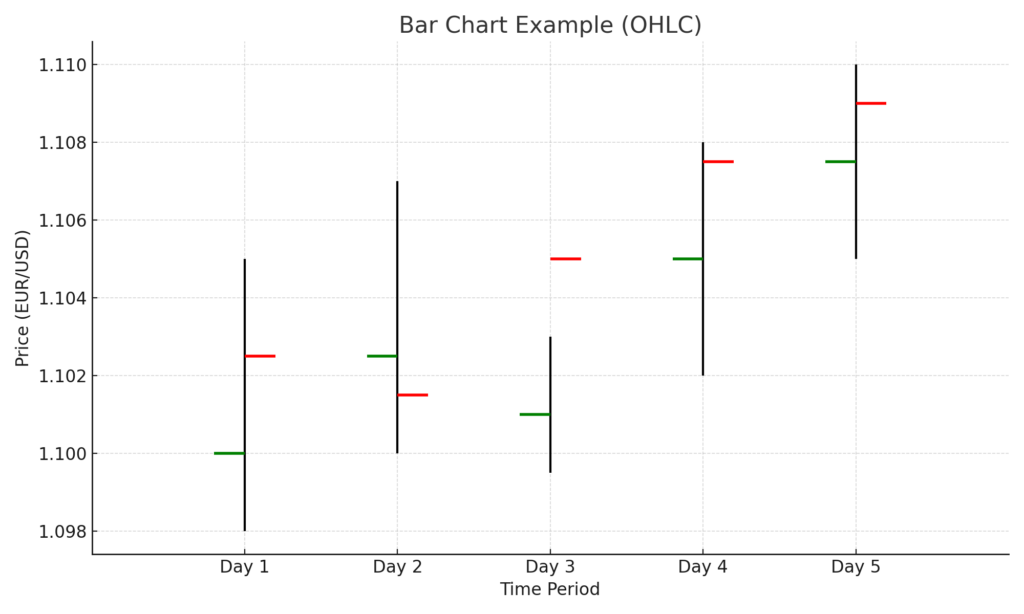
2. Bar Chart:
- Displays open, high, low, and close (OHLC) prices for each time period.
- Useful for understanding price ranges and market volatility.
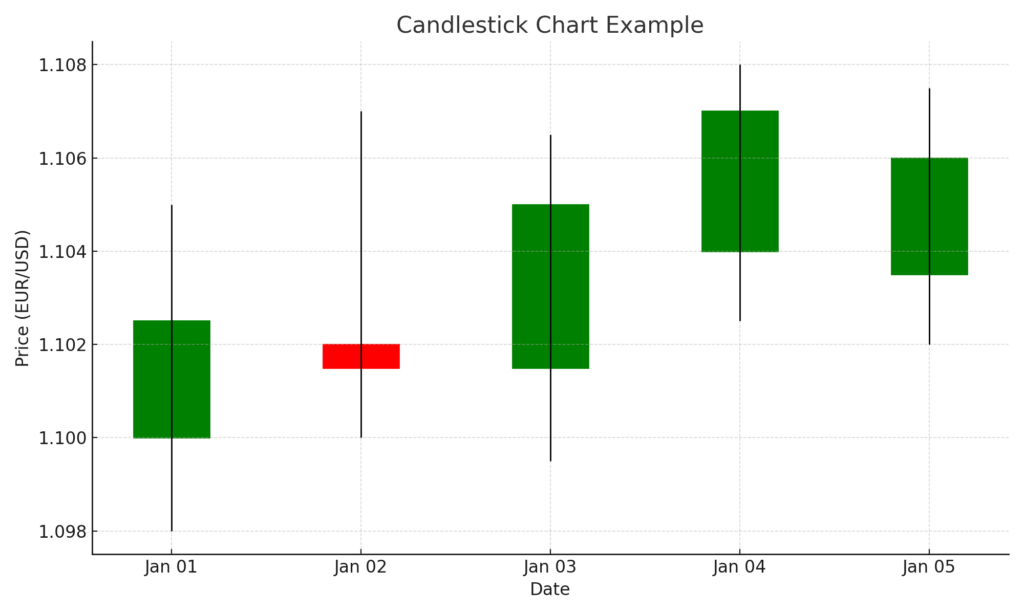
3. Candlestick Chart:
- Most popular among traders.
- Provides detailed information with ‘candles’ that show the opening, closing, high, and low prices.
- The body color (usually green for bullish and red for bearish) indicates market sentiment.
Key Forex Chart Patterns to Recognize
- Trendlines:
- Identify the general direction of the market (uptrend, downtrend, or sideways).
- Drawing trendlines helps highlight support and resistance levels.
- Support and Resistance:
- Support: Price levels where the market tends to rebound upwards.
- Resistance: Price levels where the market tends to reverse downwards.
- Chart Patterns:
- Head and Shoulders: Indicates potential trend reversal.
- Double Top/Bottom: Suggests strong resistance or support levels.
- Triangles: Symmetrical, ascending, or descending triangles signal potential breakouts.
Indicators and Tools for Forex Charts
- Moving Averages:
- Smoothens price data to identify trends.
- Common types: Simple Moving Average (SMA) and Exponential Moving Average (EMA).
- Relative Strength Index (RSI):
- Measures the speed and change of price movements.
- Helps identify overbought or oversold conditions.
- Bollinger Bands:
- Shows volatility by plotting bands around a moving average.
- Wide bands indicate high volatility; narrow bands suggest low volatility.
- Fibonacci Retracement:
- Identifies potential reversal levels based on Fibonacci ratios.
How to Approach Forex Charts Like a Pro
- Start with the Big Picture:
- Analyze longer time frames (daily or weekly charts) to understand the overall trend.
- Use shorter time frames for precise entries and exits.
- Focus on Key Levels:
- Mark major support and resistance levels on your charts.
- Look for confluence points where multiple indicators align.
- Watch for Confirmation:
- Use multiple indicators or patterns to confirm trading signals.
- Avoid acting on a single indicator alone.
- Adapt to Market Conditions:
- Recognize whether the market is trending or ranging.
- Adjust your strategy accordingly.
- Leverage Expert Signals:
- Platforms like FXProfitBuilder provide expert forex signals that help you interpret charts effectively and make informed trades.
Common Mistakes to Avoid When Reading Charts
- Ignoring the Time Frame:
- A pattern on a 5-minute chart may not hold the same significance as one on a daily chart.
- Overloading Charts with Indicators:
- Too many indicators can lead to confusion and conflicting signals.
- Stick to a few reliable tools.
- Neglecting Risk Management:
- Even the best chart analysis can fail without proper stop-loss and take-profit levels.
- Chasing the Market:
- Avoid impulsive decisions based on short-term price movements.
Conclusion
Mastering forex charts is a journey that combines technical knowledge, practice, and discipline. By understanding the basics, recognizing patterns, and using reliable tools, you can make better trading decisions. With FXProfitBuilder’s expert signals, you gain an edge in navigating the complexities of forex charts and achieving consistent success.
Start analyzing forex charts like a pro today, and take your trading to the next level.
👉 Start your journey today—subscribe to our forex pip tips service and see the difference for yourself! Sign Up to get Exclusive Offers