The Role of Volume in Forex Market Analysis
Posted On - November 13, 2025 | By - FXProfitBuilder | Categories - Advanced Trading Concepts
Introduction
Volume is one of the most overlooked yet powerful metrics in Forex trading. While price shows you where the market is moving, volume shows you how strongly it’s moving. Understanding volume helps traders gauge the conviction behind a trend, identify potential reversals, and spot institutional activity.
Let’s explore how volume analysis can transform your Forex trading strategy from reactive to predictive.
What Is Volume in Forex?
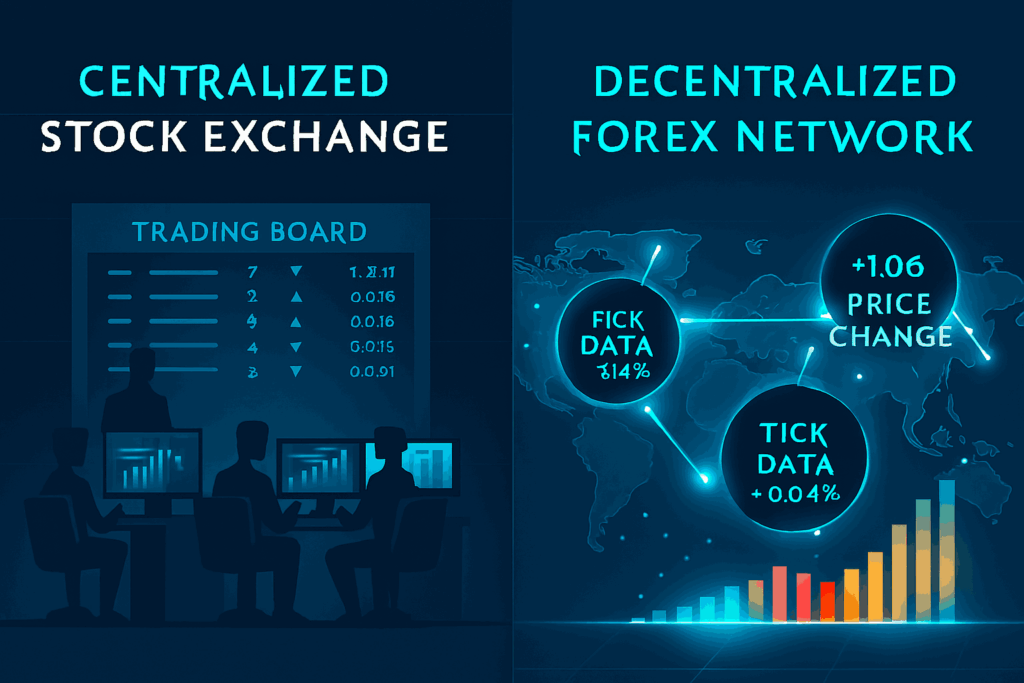
In traditional markets (like stocks or futures), volume represents the total number of contracts traded during a specific period.
However, in the decentralized Forex market, there’s no central exchange so exact trade volume isn’t available. Instead, brokers provide tick volume, which measures the number of price changes (ticks) during a specific time frame.
Surprisingly, studies have shown that tick volume correlates strongly with actual trading volume making it an effective substitute for analysis.
Why Volume Matters in Forex Trading
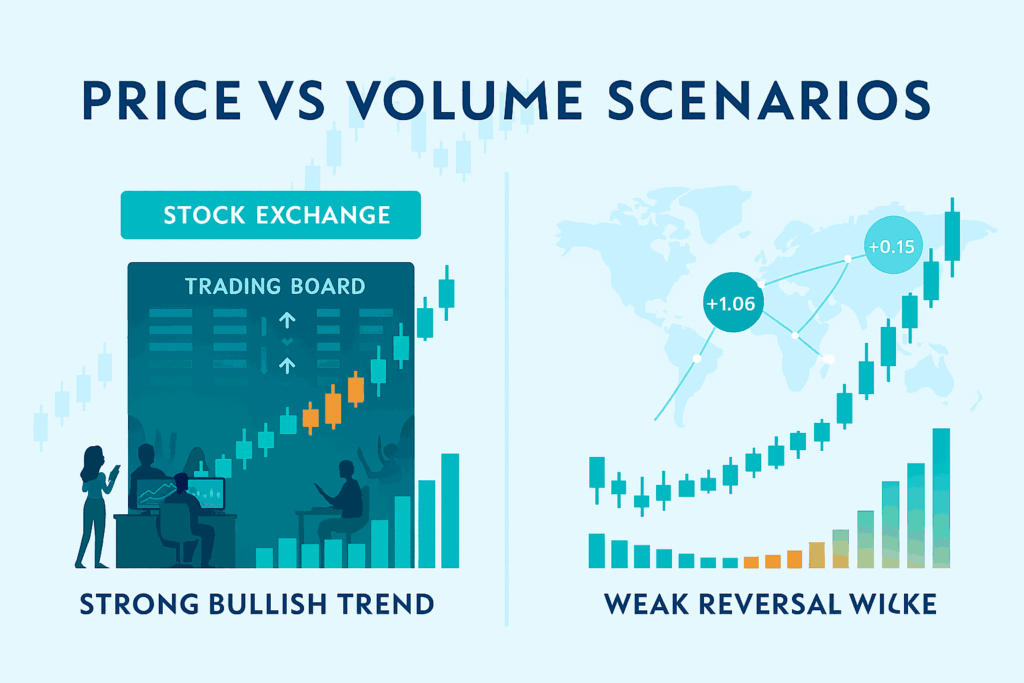
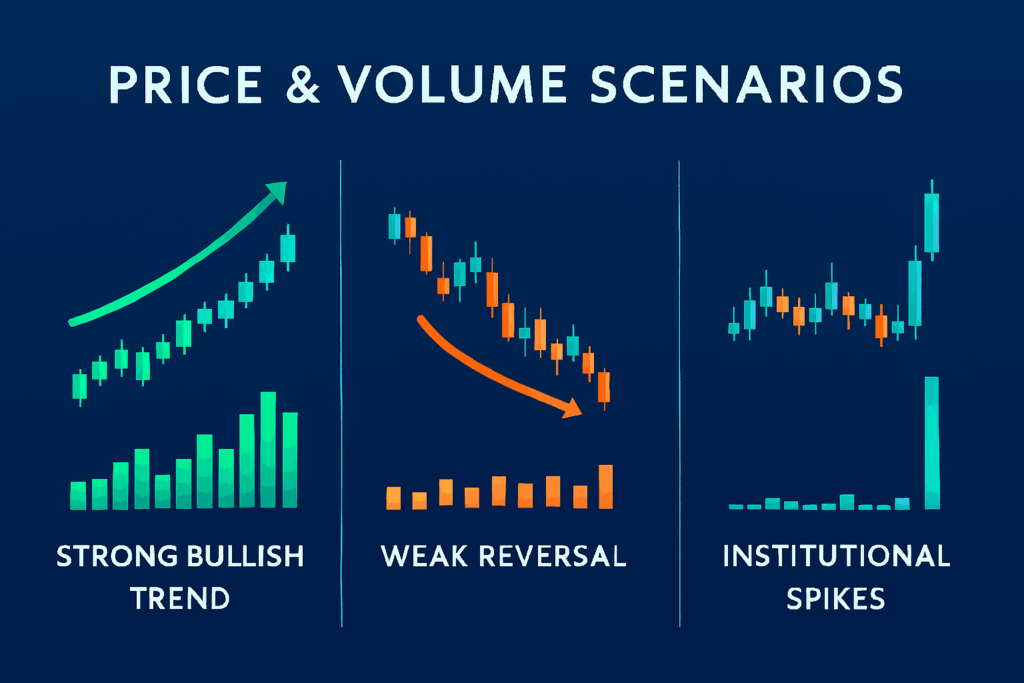
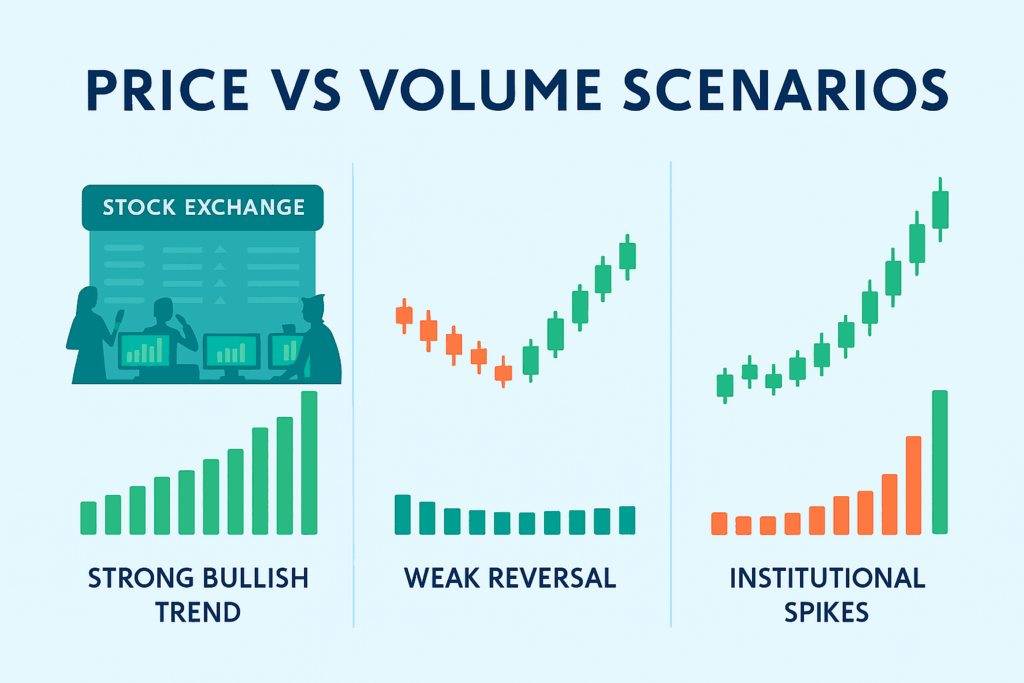
1. Confirms Price Trends
A trend supported by strong volume is more reliable than one occurring on weak volume.
- High volume + Rising price = Bullish confirmation
- High volume + Falling price = Bearish confirmation
2. Identifies Potential Reversals
When price makes new highs but volume drops, it signals trend exhaustion a potential reversal zone.
3. Reveals Institutional Activity
Sharp spikes in volume often occur when large institutions or banks enter the market. Recognizing these spikes early gives traders a strategic edge.
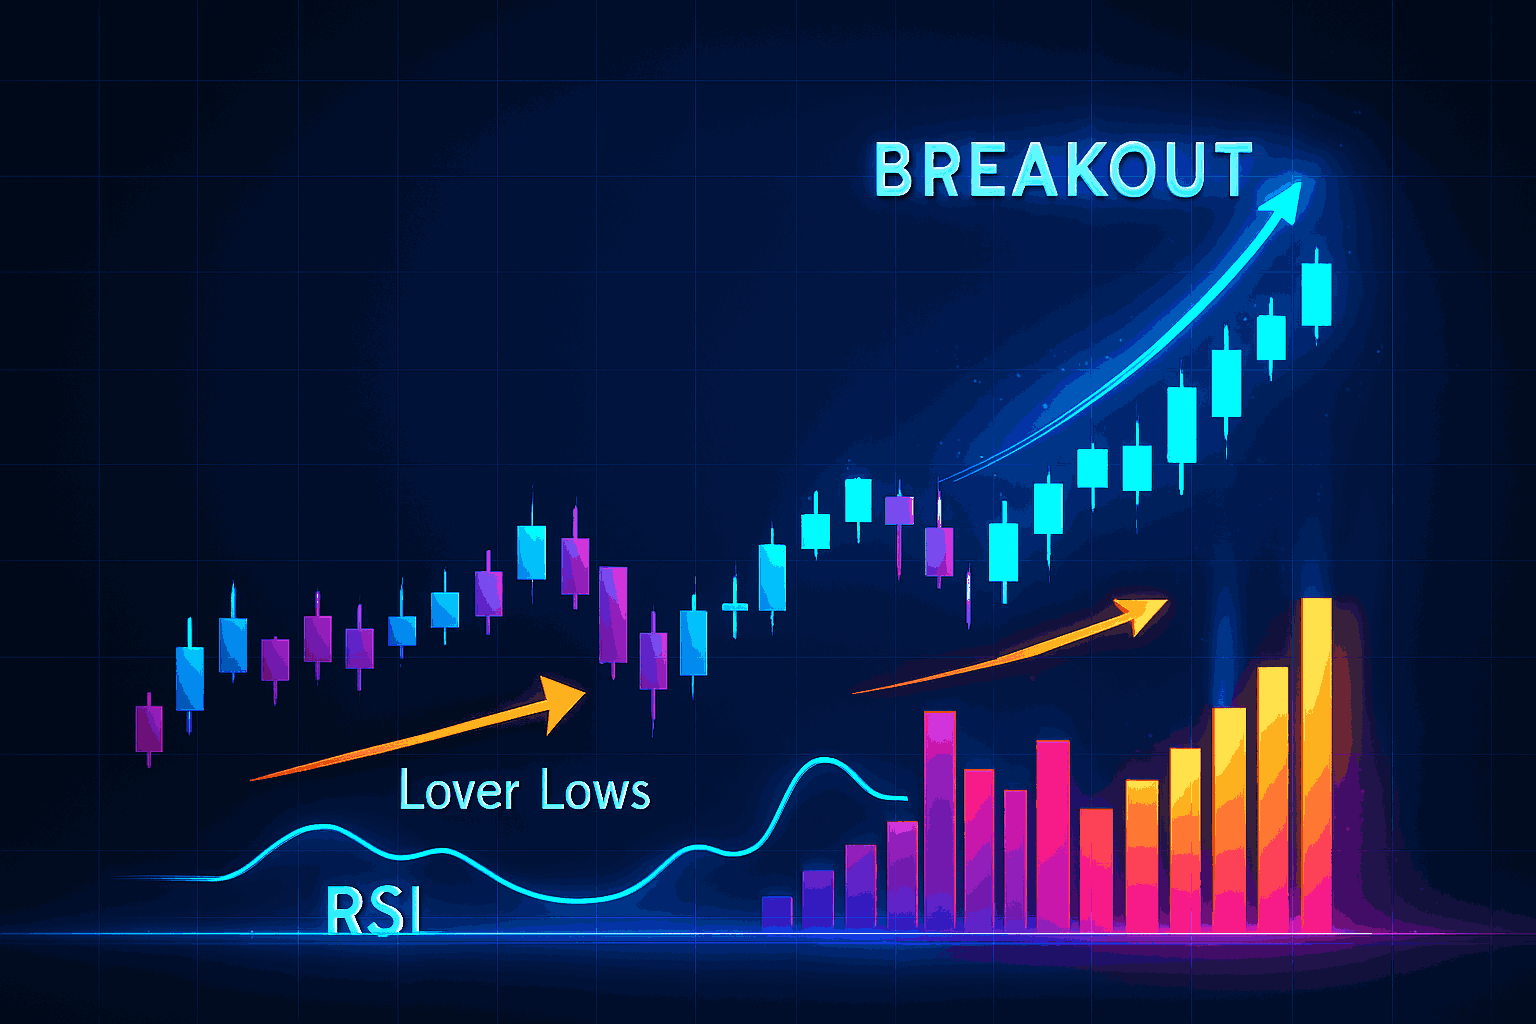
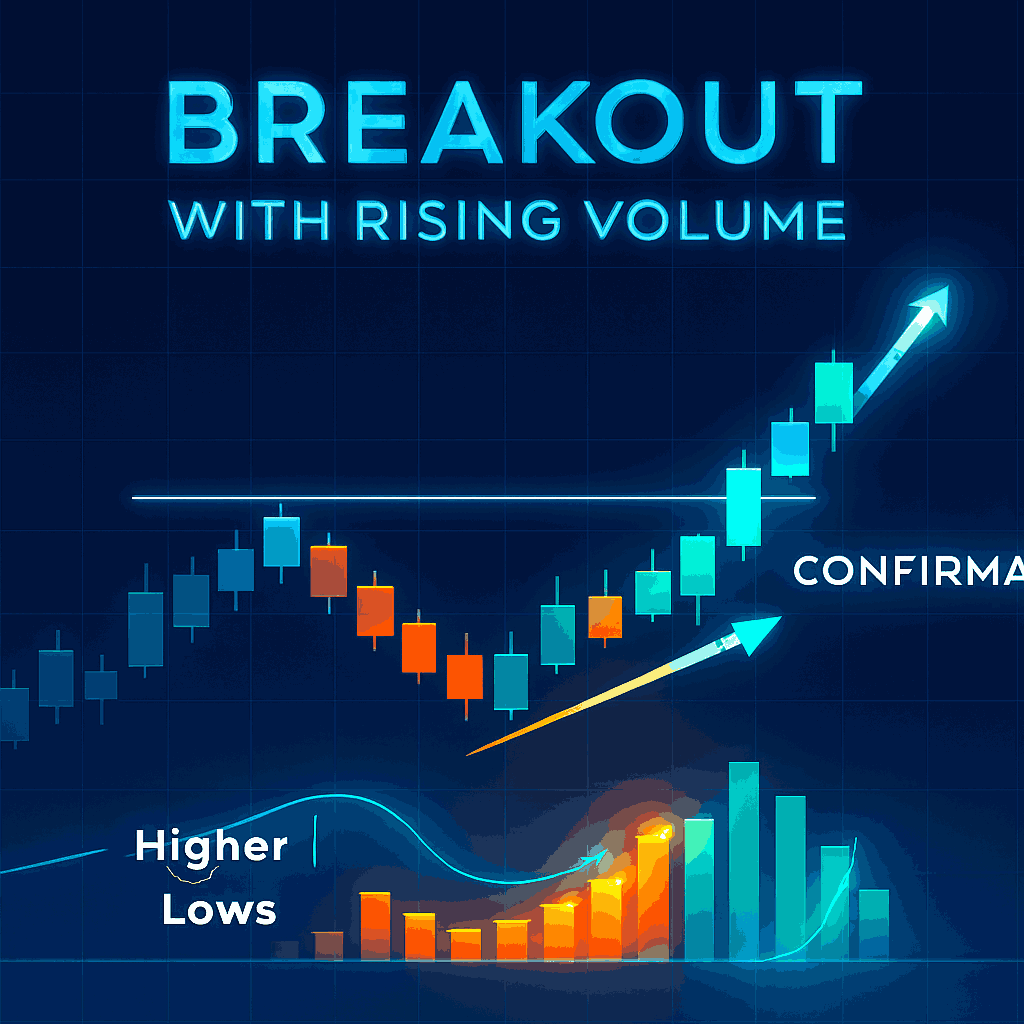
4. Validates Breakouts
True breakouts are usually accompanied by surging volume. If a breakout happens on low volume, it’s likely to be false or short-lived.
Popular Volume-Based Indicators in Forex
1. Volume Indicator (Built-in)
Shows tick volume bars beneath the price chart a simple yet effective visual cue for analyzing market participation.
2. On-Balance Volume (OBV)
Cumulative indicator that adds volume on up days and subtracts it on down days. Helps confirm whether volume supports the price direction.
3. Volume Profile
Displays traded volume at specific price levels, showing where the most activity (and interest) occurred often aligning with key support/resistance zones.
4. Money Flow Index (MFI)
Combines price and volume data to measure buying and selling pressure. Works similarly to RSI but incorporates volume strength.
How to Use Volume in Forex Trading
1. Confirm Trend Strength
When volume increases during trend moves and decreases during pullbacks, the trend is healthy.
2. Spot Early Reversals
If price keeps rising but volume steadily decreases, it suggests the trend is losing momentum.
3. Filter False Breakouts
Use volume confirmation to validate breakout setups enter only if the breakout occurs with a noticeable volume increase.
4. Combine with Other Tools
Volume analysis works best alongside price action, support/resistance, and candlestick patterns for complete confirmation.
Example: Volume Confirms Bullish Breakout
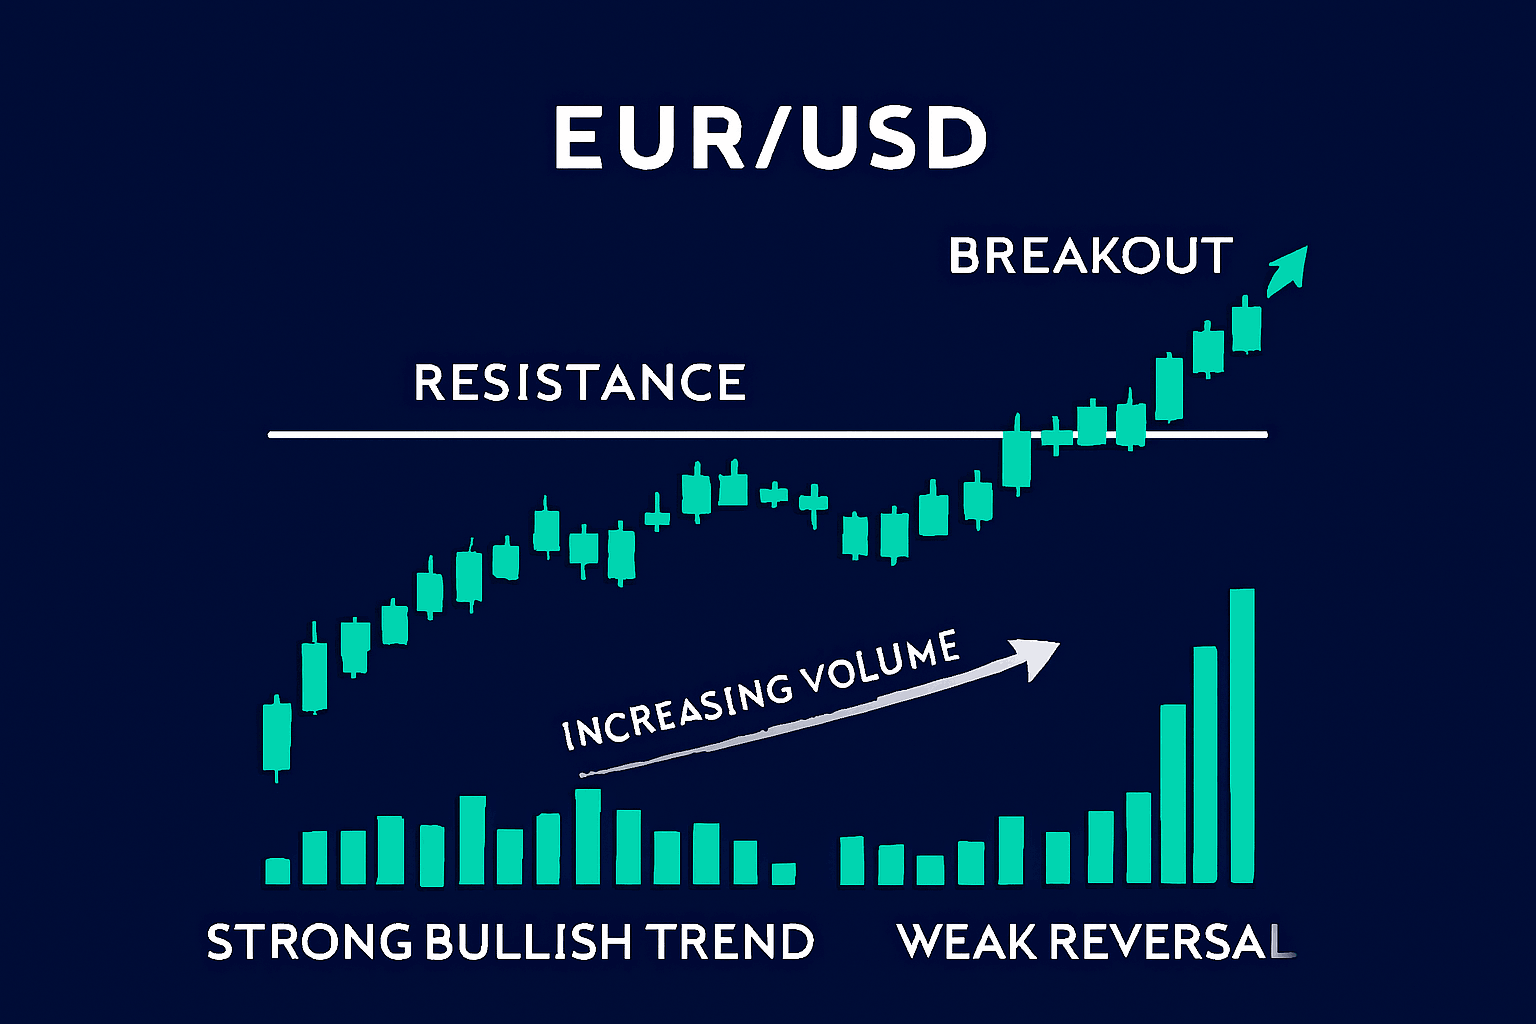
Suppose EUR/USD breaks above resistance at 1.0950 with volume doubling compared to previous sessions. This confirms strong buying interest making it a valid breakout instead of a trap.
Common Mistakes to Avoid
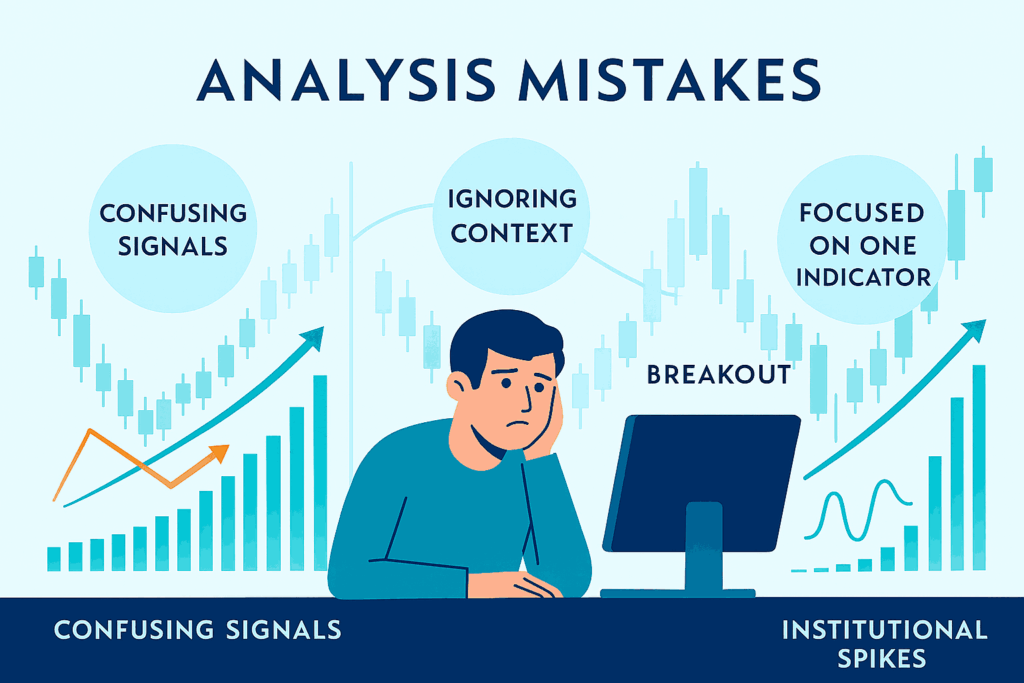
- Assuming low volume means reversal sometimes markets simply consolidate.
- Ignoring context volume spikes during news events can be misleading.
- Over-relying on a single indicator always confirm signals with price action.
Conclusion

Volume may not get as much attention in Forex as it does in other markets, but it remains a vital confirmation tool. By analyzing how much participation is behind each move, traders gain a deeper understanding of market intent. Mastering volume analysis means trading smarter not just harder.
FAQ Section
Q1. Is tick volume reliable in Forex?
Yes. Studies and broker data have proven a strong correlation between tick volume and actual trade volume, making it a reliable analytical tool.
Q2. What timeframe works best for volume analysis?
The 1-hour and 4-hour charts provide the most reliable volume patterns without excessive noise.
Q3. Can I use volume analysis for scalping?
Yes, but combine it with momentum indicators or price action since short-term volume data can be volatile.
Q4. How does volume help in news trading?
It helps confirm whether a price move after a news release is genuine or just temporary volatility.
👉 Start your journey today—subscribe to our forex pip tips service and see the difference for yourself! Sign Up to get Exclusive Offers